What does the vig take, and how sharp do you have to be to clear it? Posted betting prices, parlay costs, and prediction-market fees, with the sample size required before a winning season is evidence.
You can know the house has an edge and still believe this might be your year.
That gap is the paper. Michael Batnick calls sports betting entertainment, reports losing about seven cents per dollar, and still jokes that this could be the year. He is not alone.
You can love the sweat, the final leg, and the group chat. But beating a market is a much harder claim than picking a winner. This note puts numbers behind the difference.
Live receipt
Tonight’s ticket
Entertainment, priced before kickoff.
Wager
$50
Posted
-110
single side
Profit if it hits
$45
Modeled hole
4.5¢
per dollar at your selected win rate
What beating the market actually means
You do not need a better opinion. You need a better probability.
The app shows team versus team. Your real opponent is the posted price. To win over time, all four statements below must be true at once.
01Estimate the chance of winning better than the market does.
02Be better by enough to pay the vig, fee, and spread.
03Repeat that advantage across bets that are genuinely independent.
04Keep the same rules and an honest record through losing streaks.
Clear the price
53 / 100
Complete-ticket wins needed to clear a 52.4% break-even rate. At the default −110, 52 wins still loses money.
Show a small real edge
4,883
Independent bets to distinguish a two-point edge from noise. At ten bets a week, that is about 9.4 years.
Do not confuse luck with proof
40%
Of modeled 18-ticket runs finish ahead at your selected true win rate of 50.0%. A green season can still be noise.
The proof count is a normal approximation with 80% power. It assumes a stable edge, independent bets, and no selective memory. Shared teams, players, and game scripts make many real tickets less independent than they look. MODELED.
Try a different ticket
Pick a familiar scenario or claim an edge. Every number below will update.
Start with a recognizable ticket. Then make the claim every bettor eventually makes: how much better is your probability estimate on each pick than the posted price?
Fine-tune odds, legs, venue, and fees
$
%
%
¢
Extra house margin is an illustrative stand-in for same-game and correlated juice, not a measurement of any one book. Educational figures only — not a betting system.
I. The opponent is the price
The app frames the bet as your team against their team. Economically, you are playing against a number that already reflects what the market knows.
Fig. 1
What the posted price already takes
A -110/-110 book implies 52.4% and 52.4%. The extra 4.8% of overround is a 4.5% vig if the book is balanced. IDENTITY.
At the default −110 price, a 50/50 handicapper loses. Fifty-two wins in 100 still loses. Fifty-three barely clears the toll. Betting markets have been studied for decades as information markets, not trivia contests2,3,4,7. Finding a team you like is easy. Finding information the price has missed — by more than the fee — is the job.
II. Parlays sell a better story
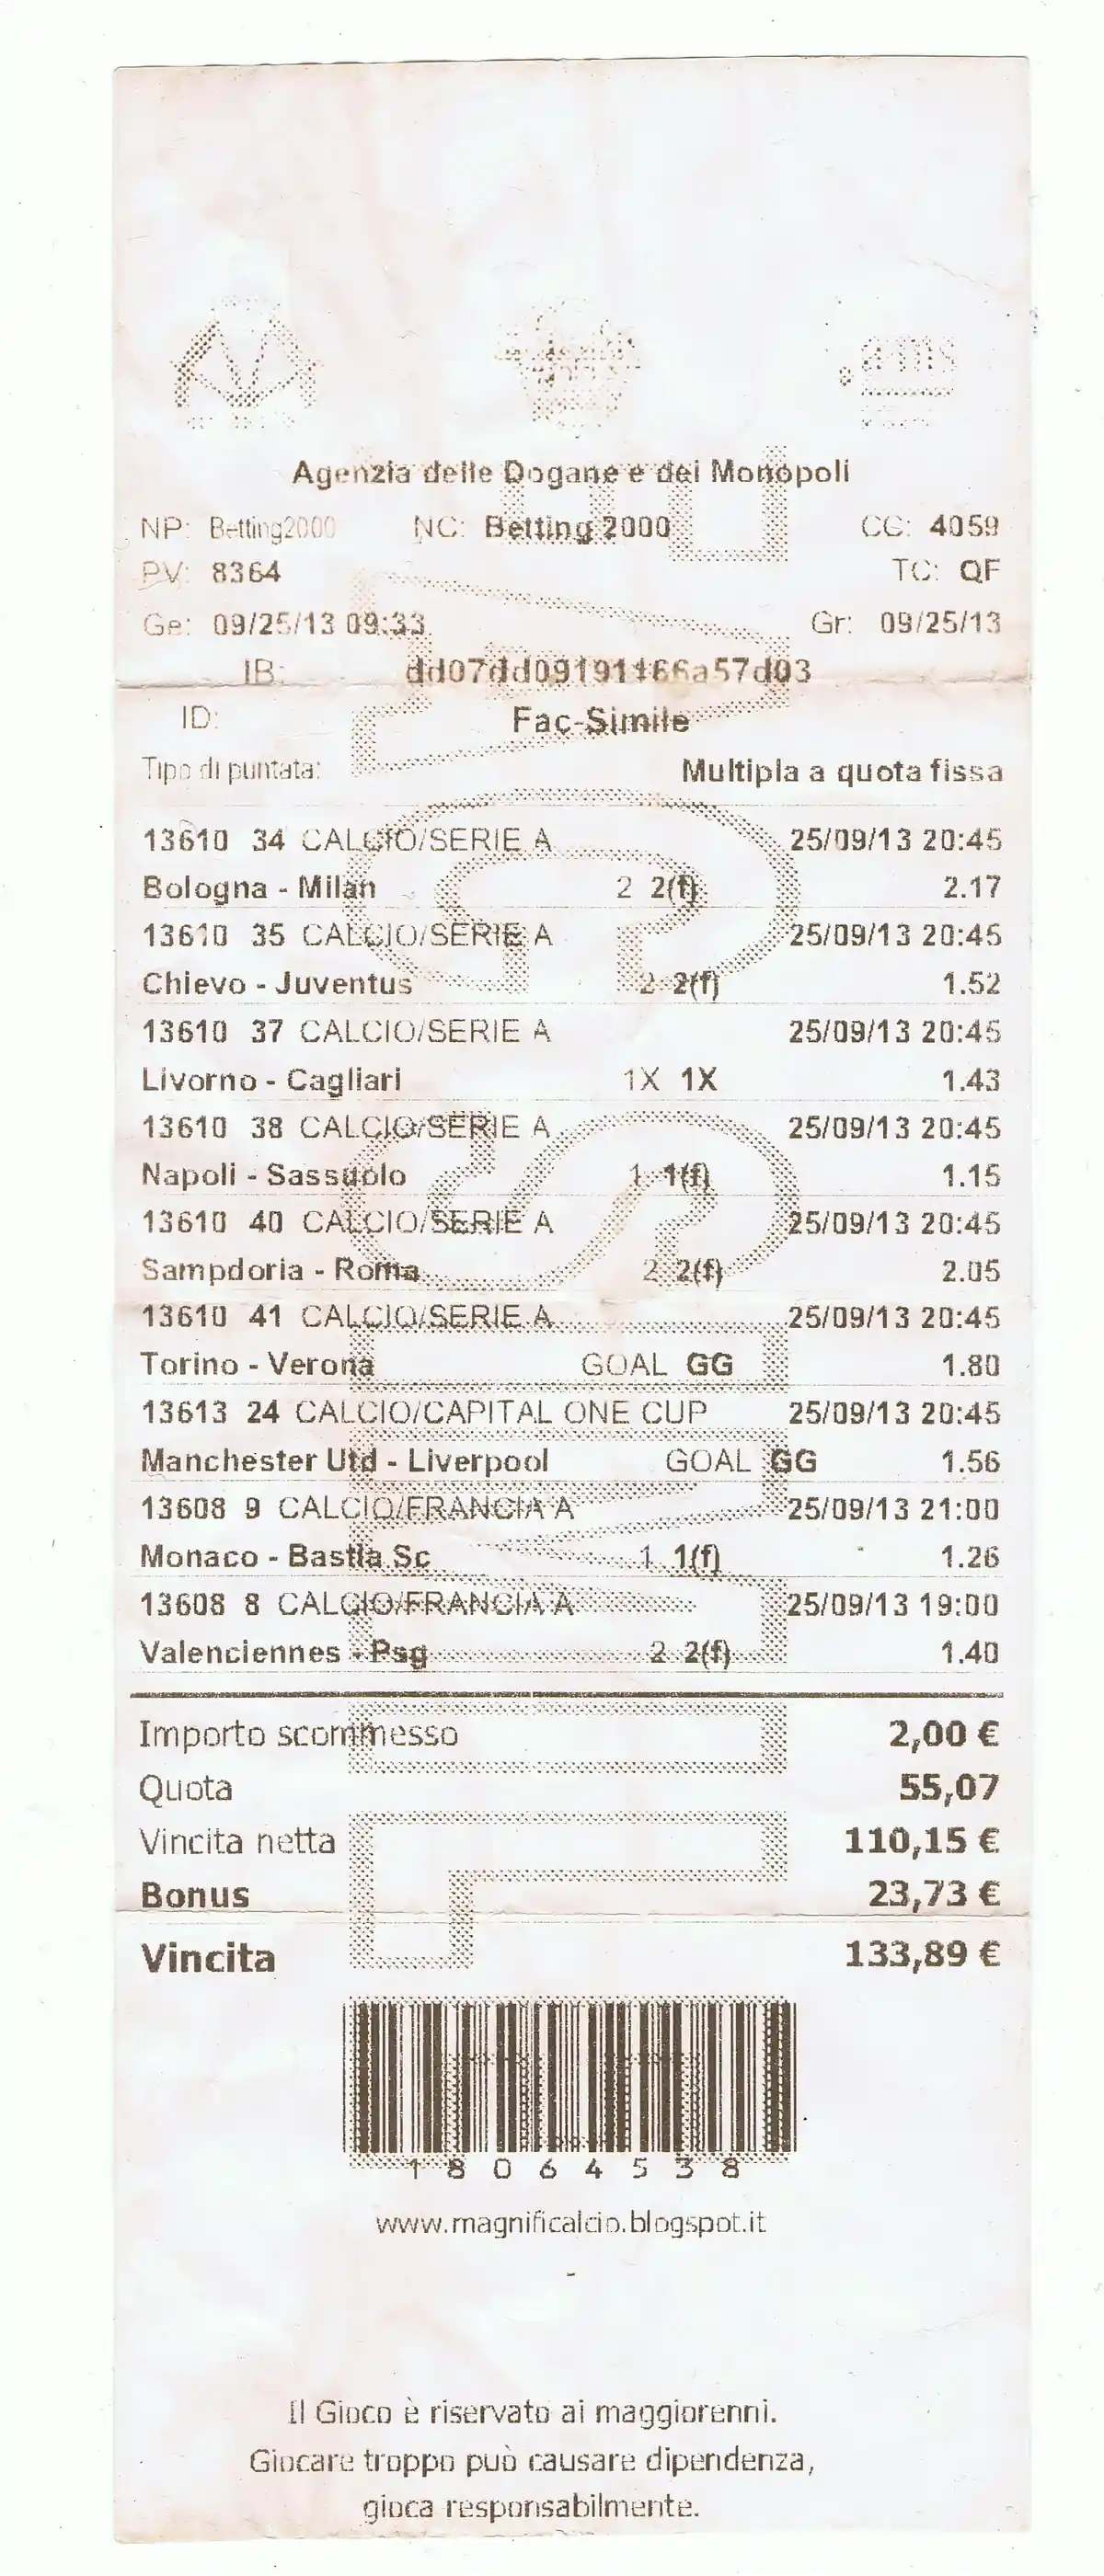
The most shareable ticket is usually the most expensive one. Every added leg gives you another way to be almost right and still receive zero.
Fig. 2
Every leg adds another toll
Same juice on every leg under independence. Solid bars: base hole; dashed outlines: total with extra margin. Extra margin 0.0¢ is an illustrative same-game surcharge. Positive values are house holes; negative values are modeled bettor edges. IDENTITY + ILLUSTRATIVE.
I lose seven cents in the dollar. Now, it fluctuates. Sometimes I have a good streak and I get down to like 5 cents. Sometimes I’m bad. I’m down to nine cents.
— Michael Batnick, Animal Spirits, on his FanDuel account — transcript
A parlay does not create an edge; it multiplies the prices you must beat. Even when the legs are independent, the juice compounds. Same-game correlation makes the real pricing harder to inspect, not easier to beat.
The near-miss meme
The group chat
One leg away. We basically had it.
The ledger
0 legs paid. Next ticket: 4.5¢ / dollar.
In slot-machine experiments, near misses increased the motivation to keep playing even though they were objective losses25. That is mechanism evidence, not a direct estimate of parlay behavior. The joke lands because the feeling is familiar; the ledger stays literal. Current ticket: 1 leg, 52.38% break-even.
Sports betting ticket: Nicholas Gemini, cropped, CC BY-SA 3.027. Meme copy is original.
III. A hot streak is not an edge
A winning week proves that you won that week. A winning season may still say more about variance than skill.
Fig. 3
A 18-ticket run can look like skill
Terminal profit and loss (USD). P(finish ahead) = 40.0% under these assumptions. MODELED.
Although I do think this might be my year.
— Michael Batnick, Animal Spirits — transcript
This is why “I am up this year” is not the same claim as “I can beat this market.” The second claim needs thousands of recorded, comparable bets. It also needs a method chosen before the results, not a story assembled afterward.
IV. A better market is harder to beat
Prediction markets can aggregate information well. That is useful for forecasting — and bad news for anyone who assumes a smart opinion is automatically a profitable trade.
Fig. 4
A better price can still be a losing price
Expected hole in cents per dollar committed. Positive = market hole; negative = modeled bettor edge; zero = break-even at the assumed probability. IDENTITY, not evidence of skill.
A calibrated 60¢ contract already says “about a 60% chance.” You do not make money merely by being right when it resolves yes. You need the true chance to be higher than the price after fees and spread. Prediction markets can produce useful information8,9 while still being a difficult product for retail traders10. Pond treats that activity as a bounded speculative sleeve→ A Wide & Deep Pond.
V. Keep the ticket a ticket
Entertainment is a valid purchase. It becomes dangerous math when the budget refills, the losses become tuition, or a hot streak becomes an investment thesis.
In 2025, state-regulated US sportsbooks kept $16,960,000,000 from $166,940,000,000 wagered — 10.16% of handle in aggregate13. That is a mixed industry hold, not your personal expected loss. It does show where the money lands when millions of entertaining tickets are added together.
Fig. 5
Set the entertainment price first
Prepaid $900 with a 4.5¢ house hole. When it is gone, the season is over. MODELED.
Educational budgeting identity, not advice. Modeled outcome is outlay × signed edge or hole in both modes when the stake is constant; refill changes the rule, not the product. Promotions, bonuses, and free bets change the hole and are not modeled. Companion thought: the same prepaid sum is a contribution in The Arithmetic of Fees.
Already-lost rule
1Write the number down first. $900 is the season’s ticket. When it is gone, the season is over.
2Keep it separate and never refill. Not next to rent, not next to an index fund, and not topped up after a losing week.
3Keep an honest score. Compare every result with the posted hurdle, not with your best Sunday. Stop when the entertainment is not worth the receipt.
…this is discretionary money that I am happy to hand over to FanDuel in exchange for entertainment.
— Michael Batnick, Animal Spirits — transcript
Author’s position
A brokerage account is where people build savings. Putting event contracts beside index funds teaches the wrong category. The author’s view is that this product should not be on Robinhood.
If betting is no longer optional, ncpgambling.org and 1-800-GAMBLER exist21.
Audit trail
Notes on method
American odds -110 imply 52.3810% and decimal 1.909091. A two-way book has overround 1.047619 and vig 4.5455%. Devig is multiplicative. Additive and Shin methods exist and are not used here.
Expected value per dollar at true p = 50.0% is −4.545¢. At a fair coin and −110 the identity is −1/22 = 4.545¢.
An independent 3-leg −110 parlay at p = 0.5 each has decimal 6.957926 and hole 13.026¢. Extra margin multiplies that decimal by (1 − m). It is not a book’s correlation model.
Polymarket sports: fee = C · 0.05 · p · (1 − p). Live check at C = 100, p = 0.50: $1.25. Kalshi classic uses 0.07 in the same family. Makers are modeled as uncharged. Spread is an illustrative input.
Power uses n ≈ ((z0.975 + z0.80)² · p̄(1 − p̄)) / δ² with δ = 2 points versus this ticket’s break-even. Live n = 4883.1. Kelly at the current p and American price is 0.00%, clamped at zero when EV ≤ 0.
Season paths: mulberry32 seed 42, 3,000 base paths with antithetic twins, independent Bernoulli trials. The mean must sit near N · EV · stake.
Hold is not vig. The 2025 AGA figure is GGR / handle on a mixed book. Batnick’s 4.5¢ and 7¢ lines stay in the quote pack until Mauboussin–Callahan can be paged.
References and image credits
1.Bachelier, L. (1900). “Théorie de la spéculation.” Annales scientifiques de l’École Normale Supérieure 3(17), 21–86. source ↗
2.Pankoff, L. D. (1968). “Market Efficiency and Football Betting.” Journal of Business 41(2), 203–214.
3.Sauer, R. D. (1998). “The Economics of Wagering Markets.” Journal of Economic Literature 36(4), 2021–2064.
4.Levitt, S. D. (2004). “Why Are Gambling Markets Organized So Differently from Financial Markets?” American Economic Review 94(2), 223–228. source ↗
5.Thaler, R. H. & Ziemba, W. T. (1988). “Anomalies: Parimutuel Betting Markets: Racetracks and Lotteries.” Journal of Economic Perspectives 2(2), 161–174. source ↗
6.Snowberg, E. & Wolfers, J. (2010). “Explaining the Favorite–Long Shot Bias: Is It Risk-Love or Misperceptions?” Journal of Political Economy 118(4), 723–746. source ↗
7.Moskowitz, T. J. (2021). “Asset Pricing and Sports Betting.” Journal of Finance 76(6), 3153–3209. source ↗
8.Wolfers, J. & Zitzewitz, E. (2004). “Prediction Markets.” Journal of Economic Perspectives 18(2), 107–126. source ↗
9.Arrow, K. J. et al. (2008). “The Promise of Prediction Markets.” Science 320(5878), 877–878. source ↗
10.Akey, P., Grégoire, V., Harvie, B. & Martineau, C. (2025). “Who Wins and Who Loses in Prediction Markets? Evidence from Polymarket.” SSRN 6443103. Working paper.source ↗
12.Kalshi Help Center (updated 19 April 2026). “Fees.” Transaction fee on expected earnings; complete schedule at kalshi.com/docs/kalshi-fee-schedule.pdf. Classic published form used in this paper: 0.07·C·P·(1−P). Retrieved 2026-08-16. source ↗
13.American Gaming Association (26 February 2026). “Commercial Gaming Revenue Hits $78.7 Billion in 2025.” State-regulated sports betting GGR $16.96 billion on handle $166.94 billion in calendar 2025. Industry source. source ↗
14.American Gaming Association (16 July 2026). Commercial Gaming Revenue Tracker, May 2026: legal sports betting revenue $1.34 billion on handle $12.06 billion; hold down 16 basis points from May 2025. Industry source. Prediction-market sports volume is outside these state figures. source ↗
15.Barber, B. M. & Odean, T. (2000). “Trading Is Hazardous to Your Wealth.” Journal of Finance 55(2), 773–806.
16.Barber, B. M., Lee, Y.-T., Liu, Y.-J. & Odean, T. (2009). “Just How Much Do Individual Investors Lose by Trading?” Review of Financial Studies 22(2), 609–632.
17.Barber, B. M., Lee, Y.-T., Liu, Y.-J. & Odean, T. (2014). “The Cross-Section of Speculator Skill: Evidence from Day Trading.” Journal of Financial Markets 18, 1–24.
18.Kumar, A. (2009). “Who Gambles in the Stock Market?” Journal of Finance 64(4), 1889–1933.
19.Ellis, C. D. (1975). “The Loser’s Game.” Financial Analysts Journal 31(4), 19–26. source ↗
20.Bogle, J. C. (2014). MarketWatch interview (the “funny money” 5% account). Cross-reference: drewbreyer.com/pond.
21.National Council on Problem Gambling. Help and treatment: ncpgambling.org and 1-800-GAMBLER. Prevalence estimates vary by instrument and year; this page does not diagnose. source ↗
22.Mauboussin, M. J. & Callahan, D. (2026, August 5). “The Wisdom of Crowds in Markets: Crowd Behavior in Prediction, Betting, and Stock Markets.” Morgan Stanley Investment Management, Consilient Observer. Linked in the episode show notes; report figures have not been independently reproduced here. source ↗
23.Batnick, M. & Carlson, B. (2026, August 12). “Depressed Day Traders.” Animal Spirits. Official show notes link the Mauboussin and Callahan report; betting and prediction-market discussion at approximately 25:10–34:50. Transcript timestamps are approximate. source ↗
24.IRS Publication 529, Miscellaneous Deductions — casual gambling-loss treatment is jurisdiction- and year-specific; cited only as a pointer, not modeled. source ↗
25.Clark, L., Lawrence, A. J., Astley-Jones, F. & Gray, N. (2009). “Gambling Near-Misses Enhance Motivation to Gamble and Recruit Win-Related Brain Circuitry.” Neuron 61(3), 481–490. Slot-machine task; mechanism evidence, not a sports-betting estimate. source ↗
26.Oniff. “Roulette casino.” Wikimedia Commons. CC BY-SA 4.0; resized and converted to WebP. Archived illustration, no longer used as the opening image. Retrieved 2026-08-16. source ↗
27.Gemini, N. “Sports betting tickets in Italy.” Wikimedia Commons. CC BY-SA 3.0; resized, converted to WebP, and cropped for the visual interlude. Retrieved 2026-08-16. source ↗